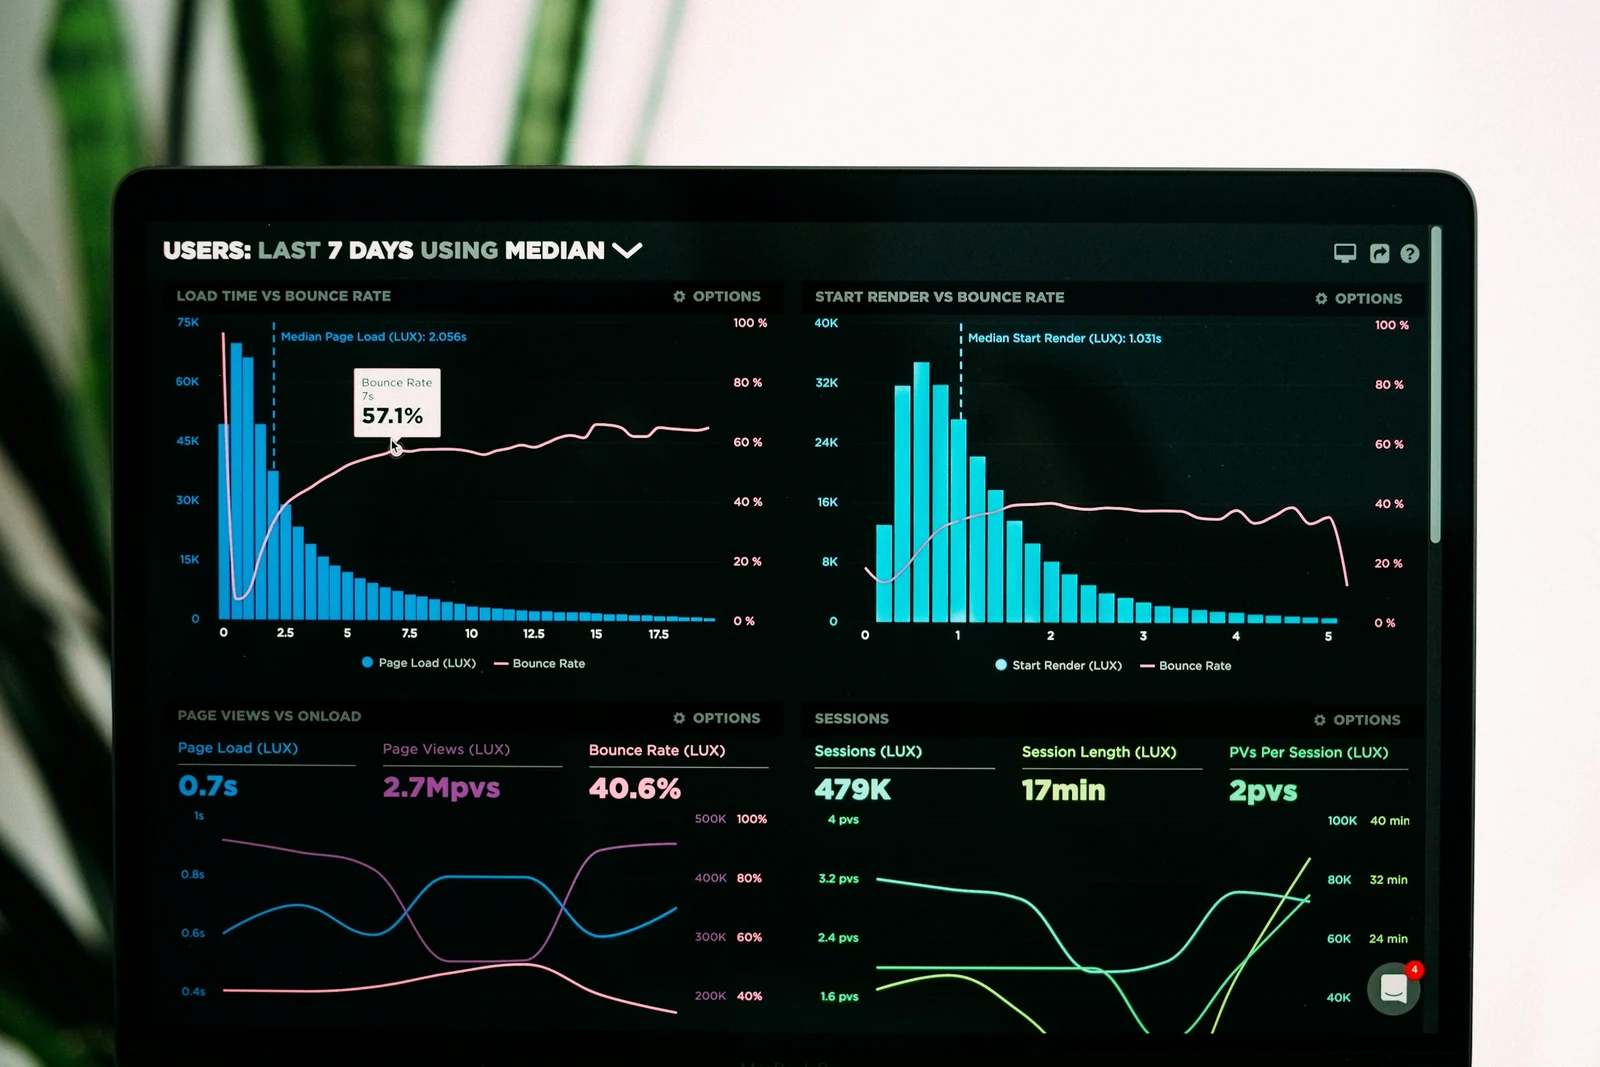
Many dashboards are built by putting every available number on a screen. They look busy, impress briefly and are then forgotten. Useful dashboards start from the decisions people need to make.
Start with decisions, not data
For each audience, ask what decisions they make regularly and what information would help. A branch manager deciding on staffing needs different information from a finance director reviewing monthly performance.
Choose a small number of measures
Select the handful of measures that matter most for each audience. Every measure should have:
- a clear definition everyone agrees on;
- a known data source;
- a sensible comparison, such as a target, the previous period or the same period last year.
A number without context rarely helps anyone decide anything.
Put the most important information first
Place key measures at the top, where people look first. Use size and position to show importance, and group related information together. Supporting detail can sit lower down or behind a link.
Choose the right chart
- Trends over time: line charts.
- Comparing categories: bar charts, sorted in a meaningful order.
- Part of a whole: use sparingly; a simple bar chart is often clearer than a pie chart.
- Exact values: a well-formatted table.
Avoid decorative effects, such as 3D charts, that make values harder to read.
Use colour with purpose
Use a calm base palette and reserve strong colours for meaning, such as highlighting a measure that is off target. Do not rely on colour alone; label clearly so the dashboard works for people with colour vision deficiencies.
Allow drilling down
When a measure looks unusual, people want to know why. Let them move from summary to detail, such as from a regional total to individual branches, without leaving the dashboard.
Show freshness
State when data was last updated. If data is late or incomplete, say so rather than letting people draw conclusions from partial information.
Review usage
Check which dashboards and measures are actually viewed. Retire those nobody uses and improve those people rely on. A short, trusted dashboard is more valuable than a comprehensive one that no one opens.